Google Analytics for Clicklaw Website Contributors
This is a help page for contributors or users.
- This page contains no legal help information.
- See other Clicklaw Wikibooks Guides.
Clicklaw uses Google Analytics (GA) to collect, report, and analyze data about its website usage. The report featured below shows outbound traffic from Clicklaw to contributor websites. The metric here is the number of clicks on links to contributor websites. Each time a Clicklaw visitor clicks the link, Google Analytics reports it as one click. Currently, we only provide the instruction for viewing the outbound traffic report. We welcome any suggestions on other reports that could be useful for Clicklaw contributors and will be happy to share them here. Please email editor@clicklaw.bc.ca with your suggestions.
 |
For PDF files, Clicklaw generally sends traffic directly to the files residing on your web server, which is reported in the above report. When your website is using Google Analytics to track inbound traffic, this direct-to-PDF traffic does not get reported because of the way GA tracking works. Clicklaw’s report can then provide a piece of the missing picture and complement your own GA report. |
Google Analytics Account
You could log in to Google Analytics to access the report using Clicklaw's account or using your own account.
Using Clicklaw's GA account
Clicklaw has a GA account for contributors. When you log in to Clicklaw, you can see the information about the user name and password for this purpose.
Using your own GA account
If you already have a GA account, we could give permission to your account to access Clicklaw's GA reports. This way, Clicklaw will show up under your list of sites whenever you log in to your GA account. Please let us know your GA account's email address by sending an email to editor@clicklaw.bc.ca.
Viewing the Report
- Go to http://www.google.ca/analytics/.
- Enter the user account and password
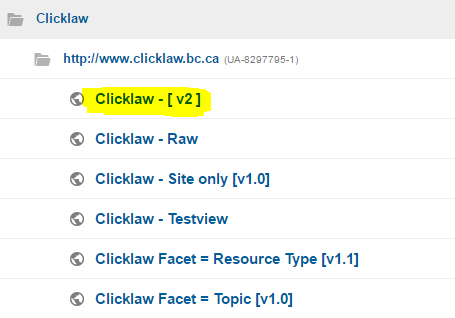
- Click on Clicklaw – [v2].
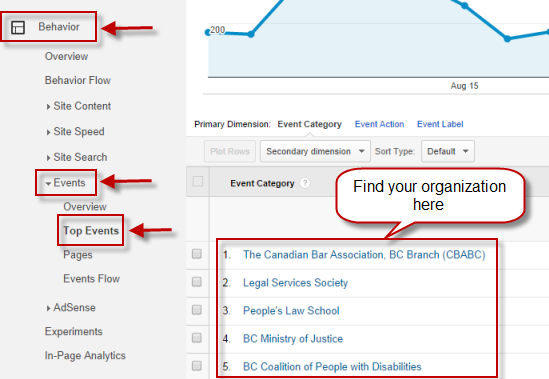
- Go to Behavior --> Events --> Top Events. You will see a list of organization names on the screen. Click on your organization name to see your report.
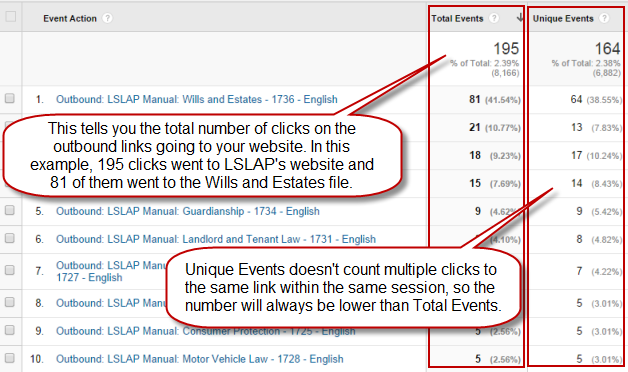
- You will see a list of resource titles/service names and the traffic data in a table.
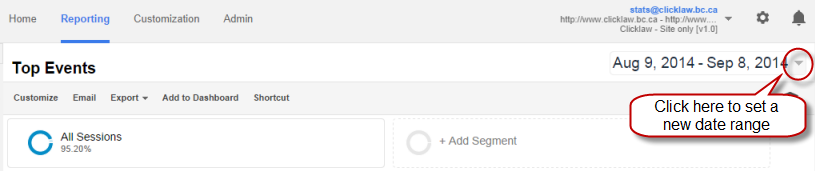
- By default, the date range for the report is set for the past one month. You can change this using the date range menu.
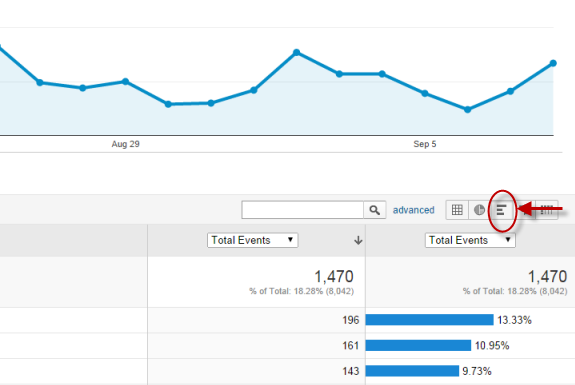
- You may want to change how the report looks like. Switching the display option to Performance will show you a bar chart instead of just numbers. Click on the icon as shown below.
Filtering the report
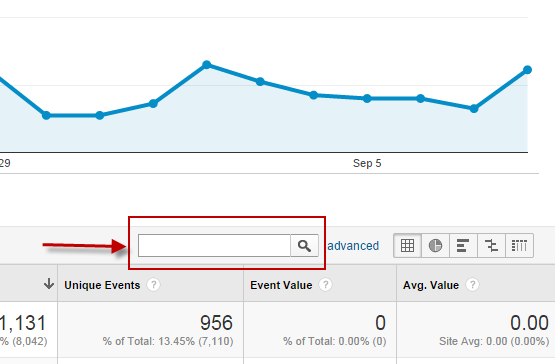
You can filter the report if you'd like to search for specific resources. For example, you have a resource that is available in several languages and you'd like to see how much traffic went to each of the language version.
- Enter your search keywords and click on the search icon.
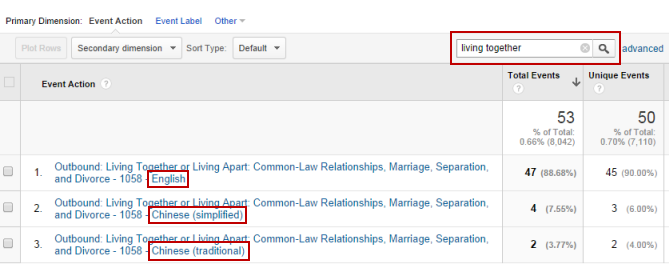
- The example below shows the English and non English editions for a resource.
Exporting the report
You may want to export the report, for example into an Excel or a PDF file, to share it with others in your organization.
- Click on Export to reveal a selection of available format.
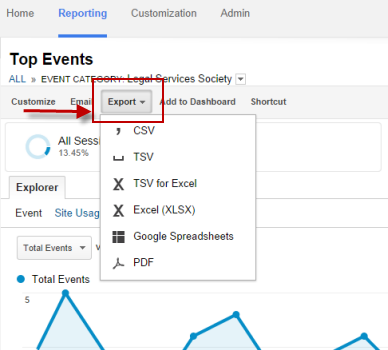
- Select a format to download the report file.
| ||||||||||||||||||||||||||||||||||